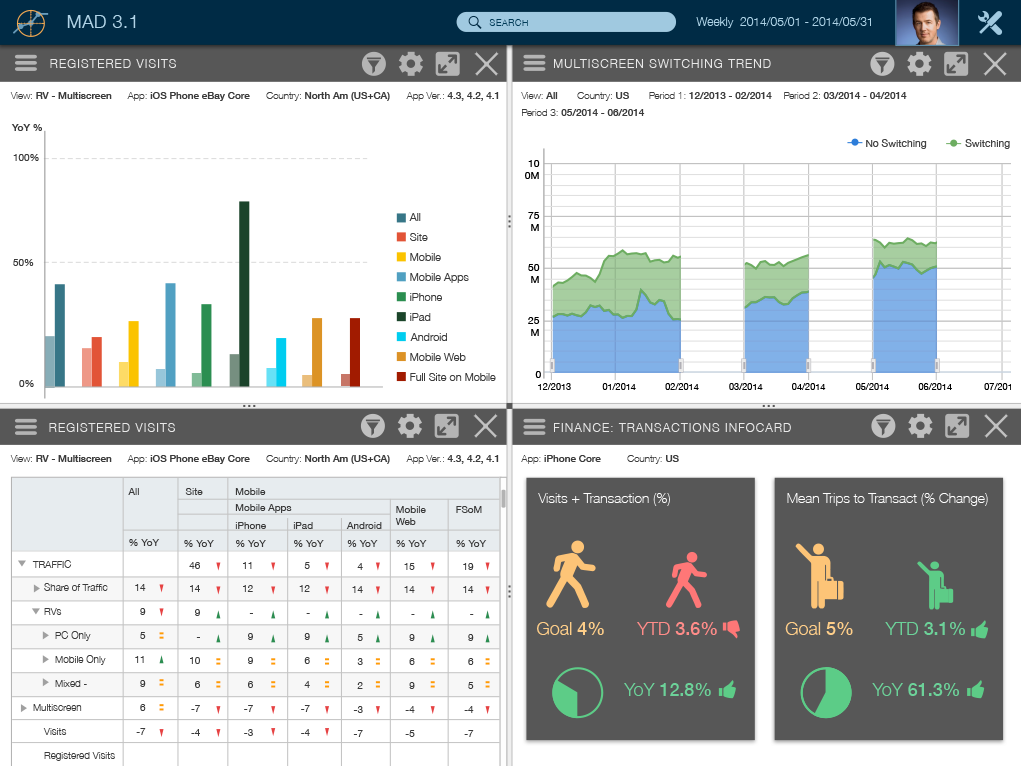
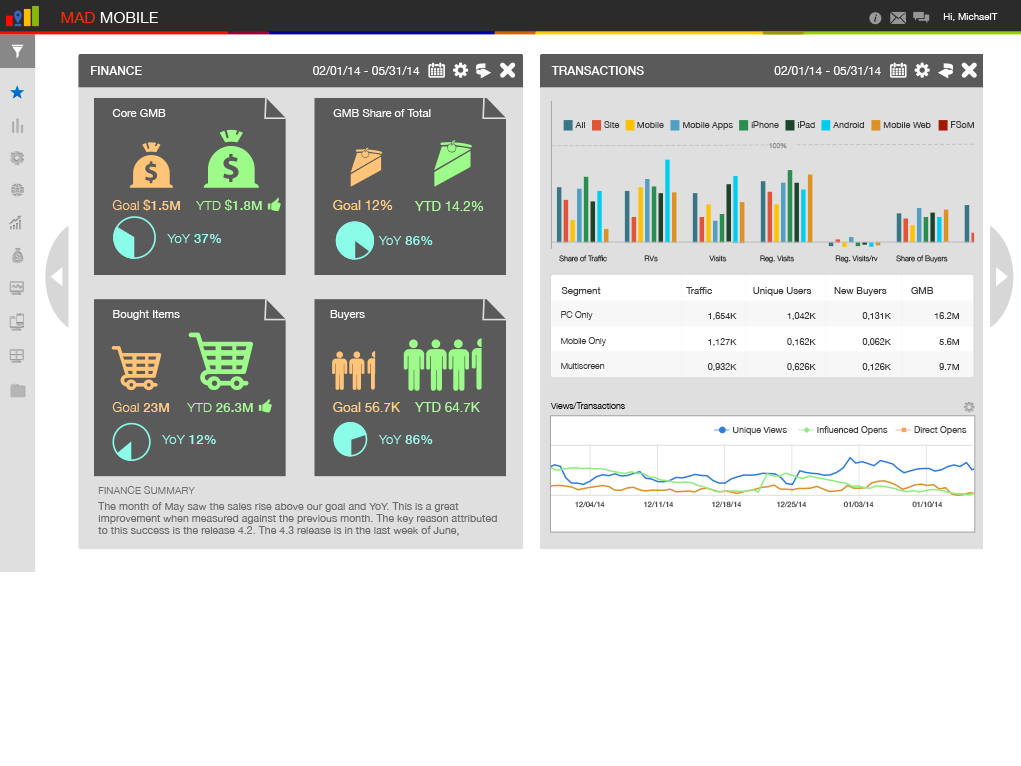
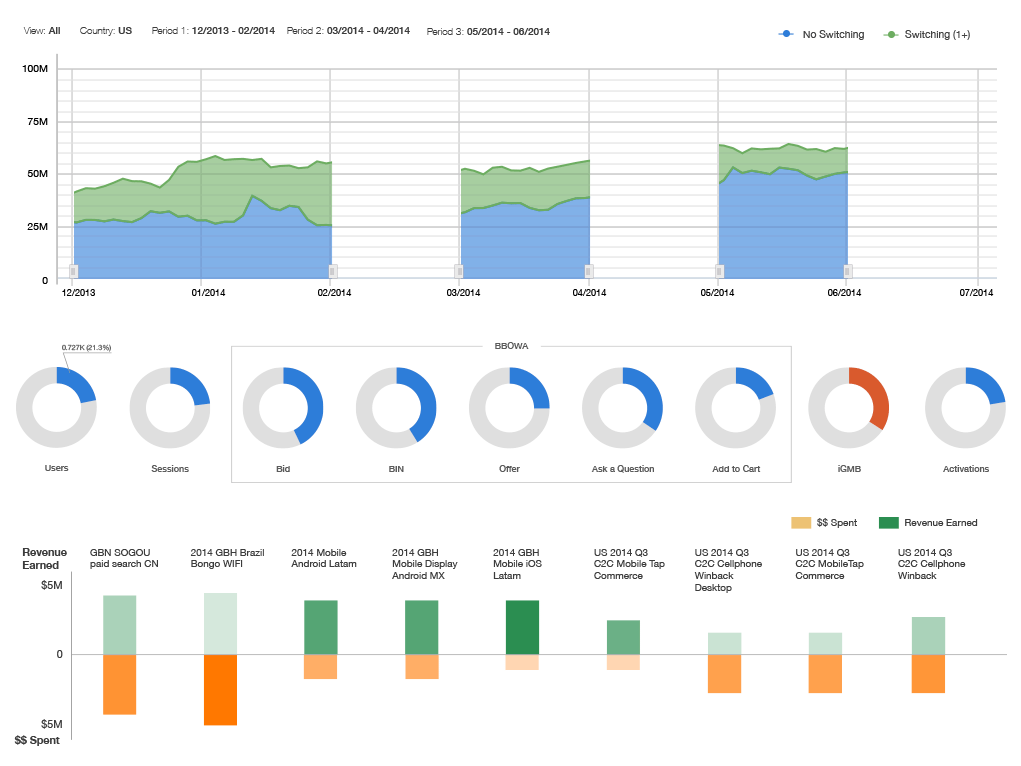
Segmentation allows users to see both, charts and infographics.
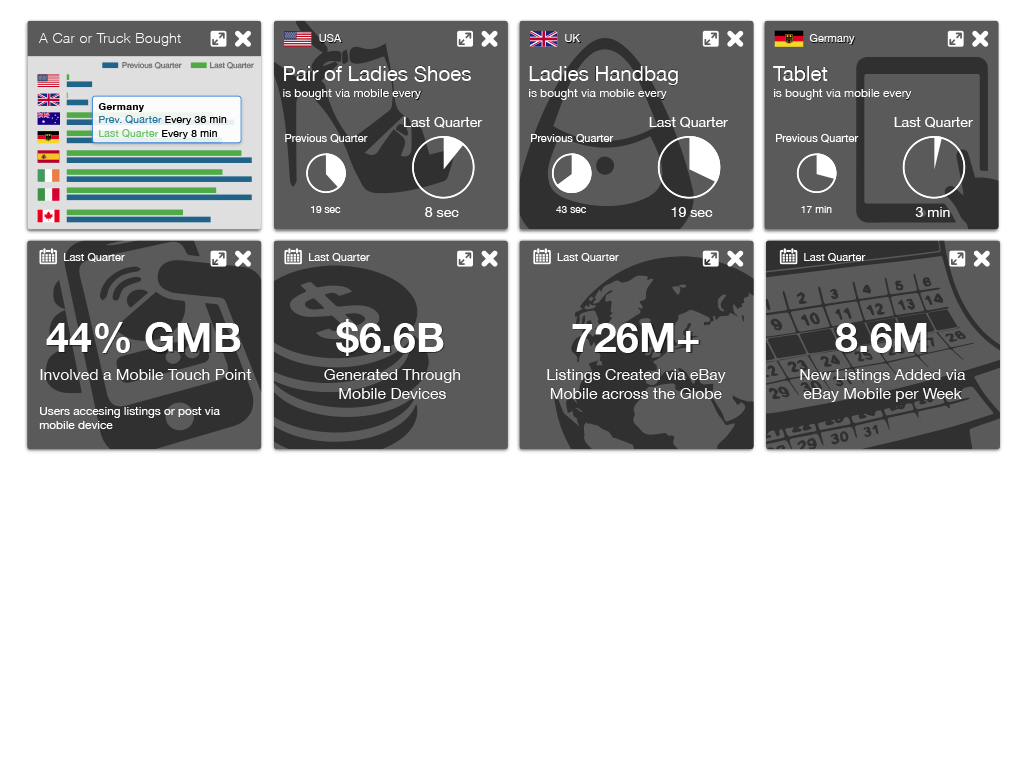
Infographic "flip cards"
Big infographic "cards" provide enough room for charts and tables.
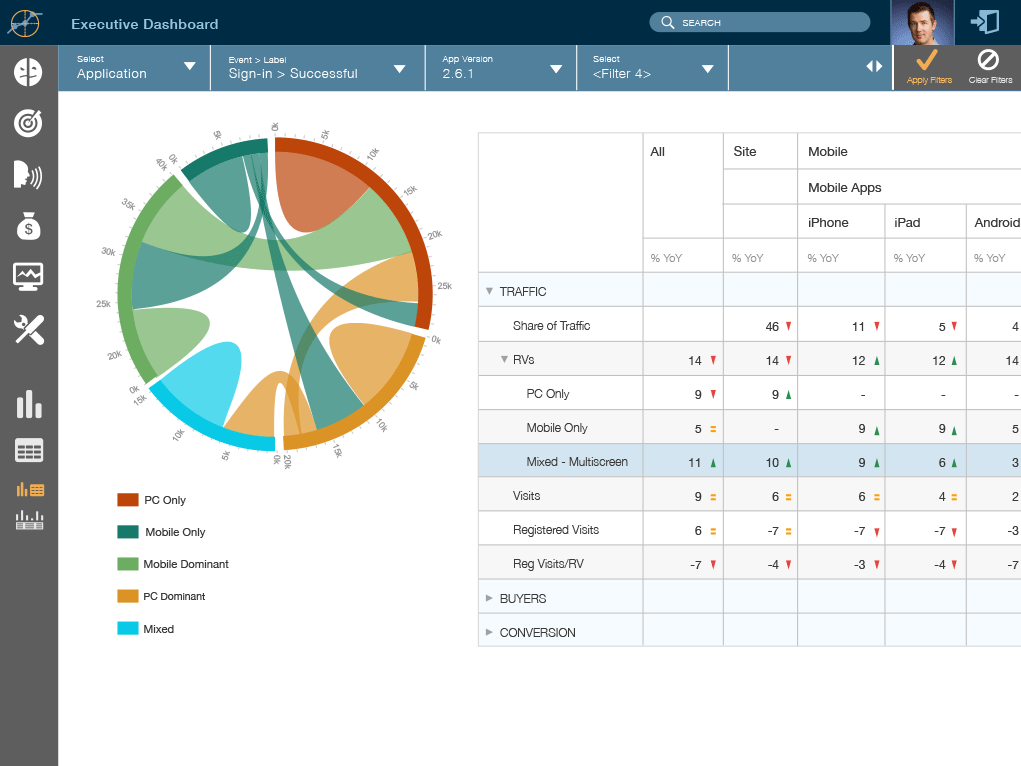
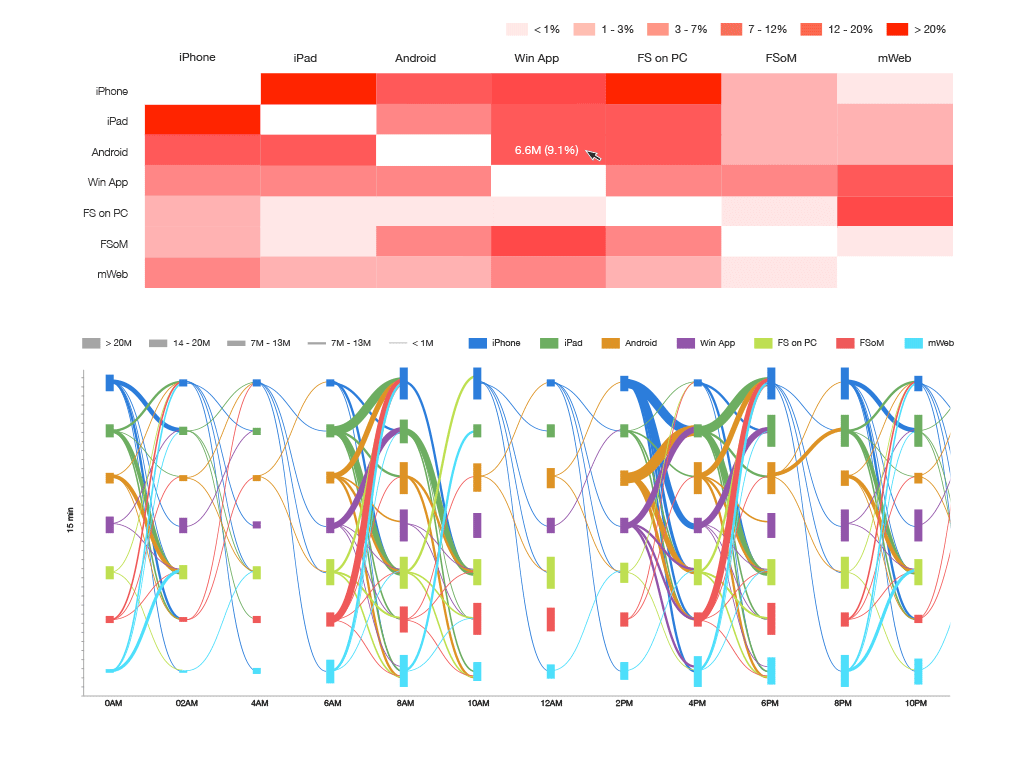
d3.js offers advanced means of visualization. Chord charts are good for multiple connections.
100% Highcharts. Custom skinning to improve the look.
Heat map and Sankey Diagram
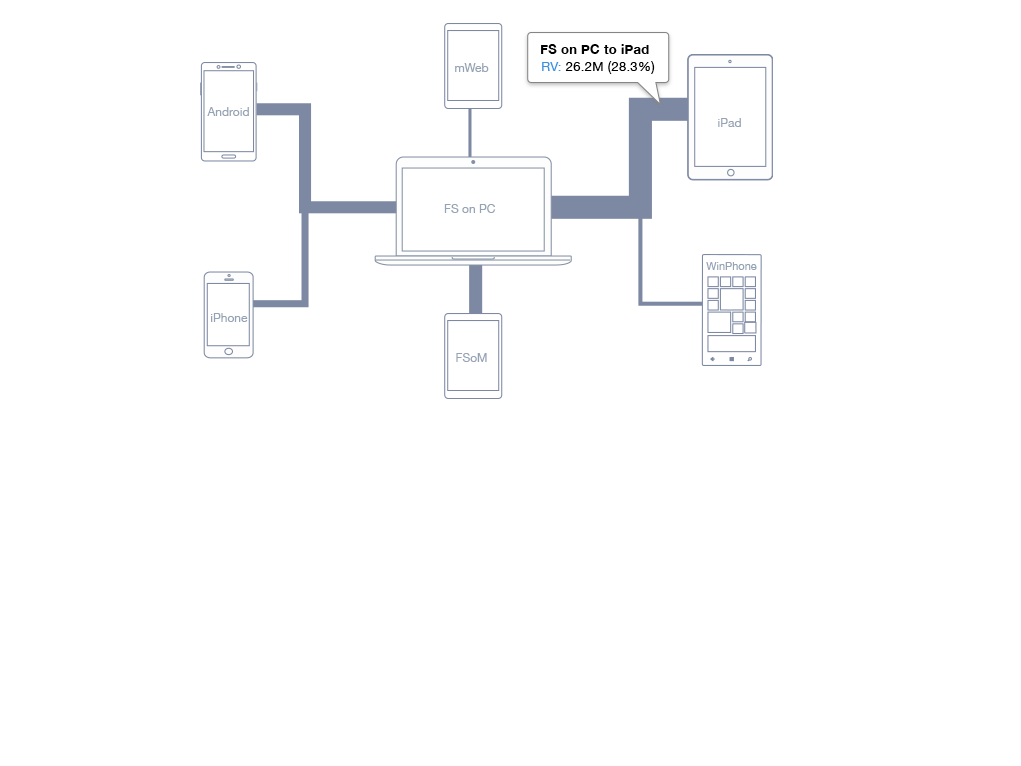
Sometime a custom diagram is better than connecting boxes.
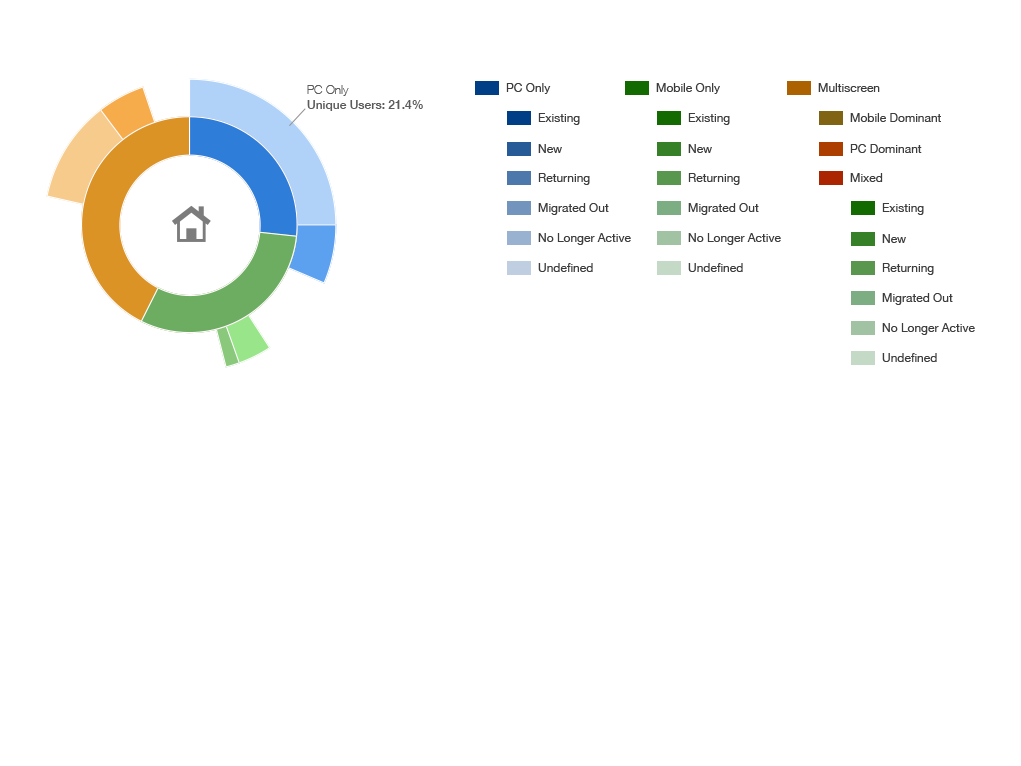
Sunburst Chart, i.e. multi-level donut chart
See how it all works together in
Axure prototype >
1
2
3
4
5
6
7
8
9