Landing page: Speed Visualization Principles.
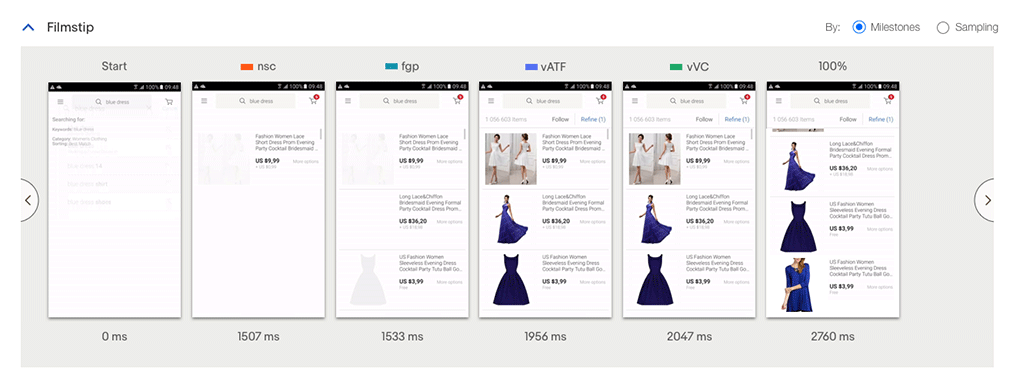
For native mobile apps screen grabs during page loading is the only way. Any device and location can be simulated.
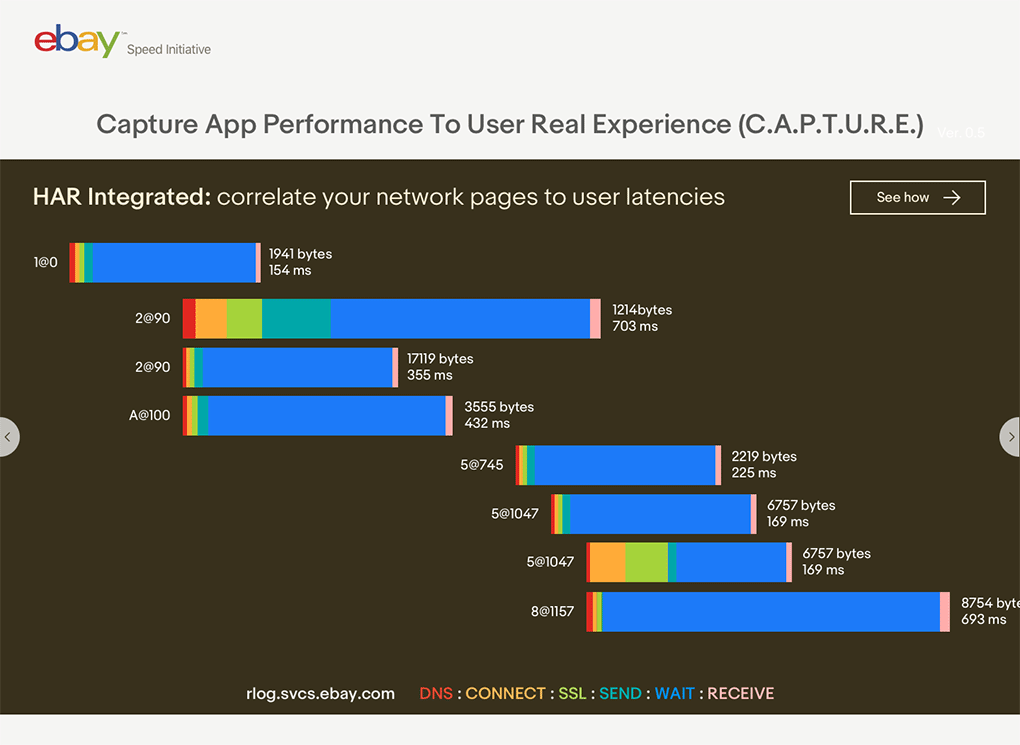
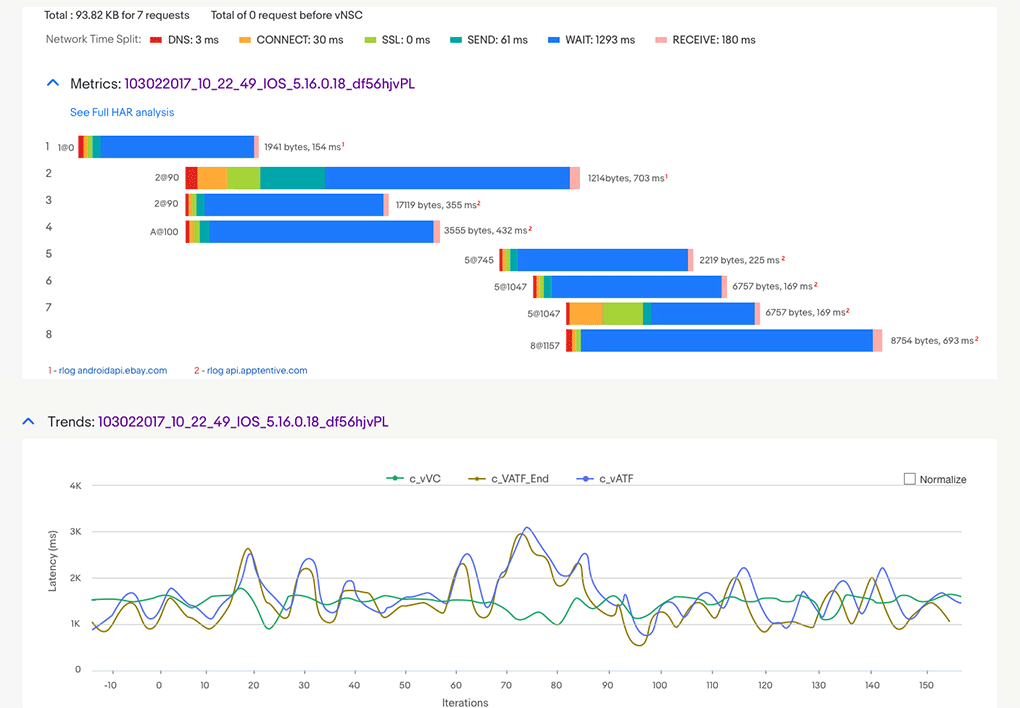
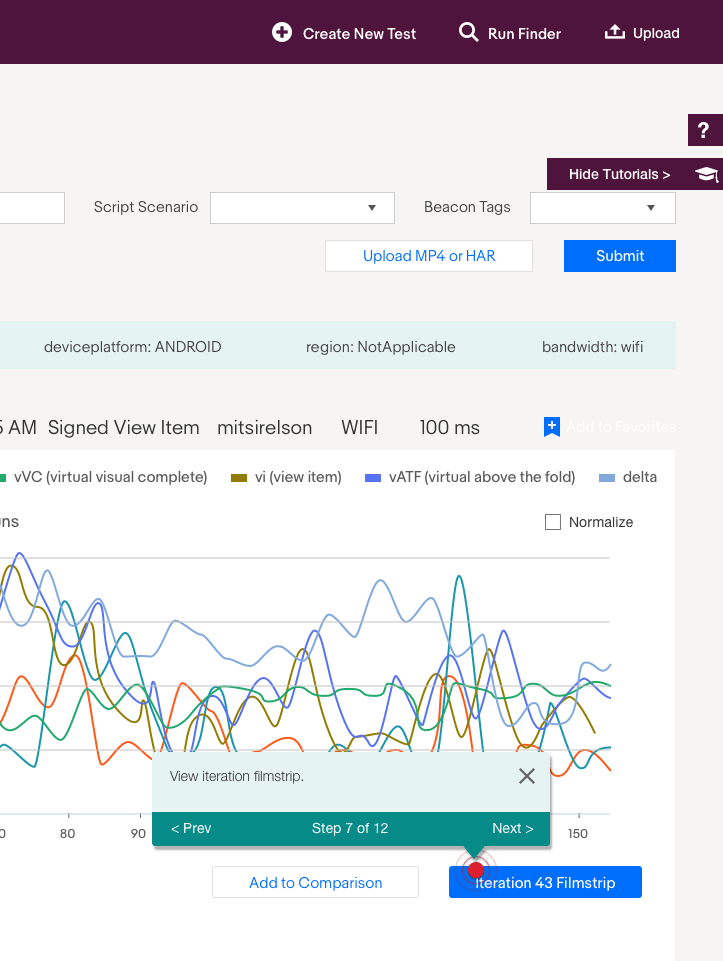
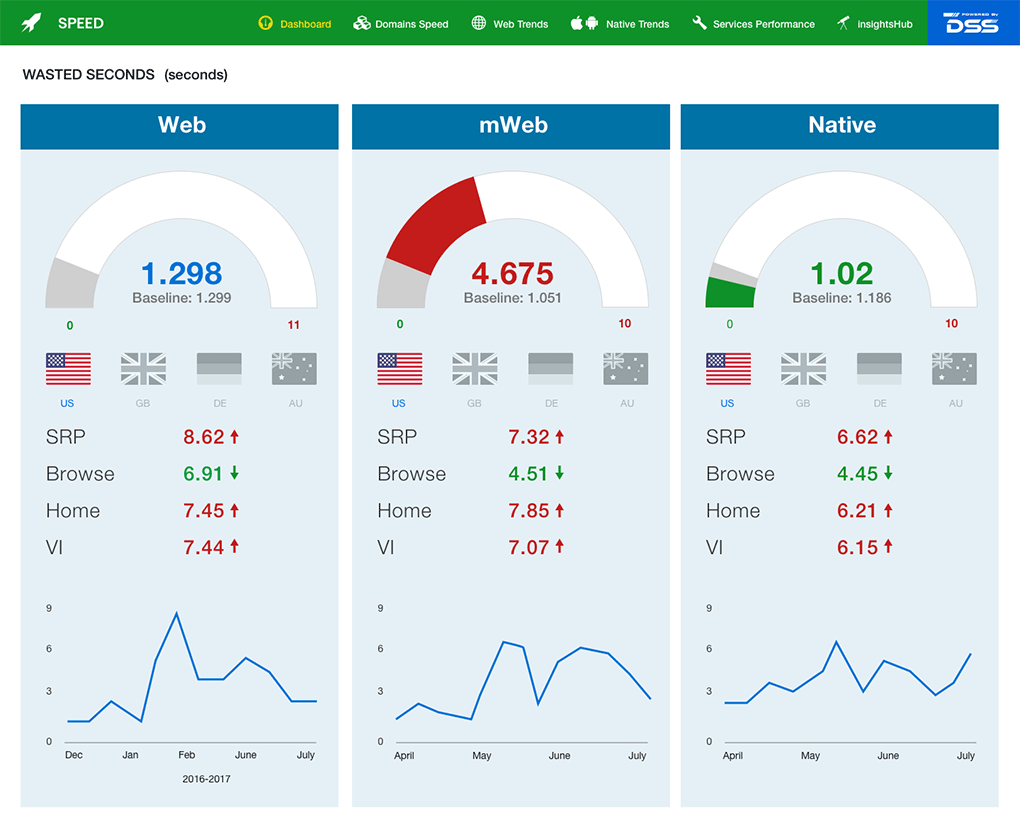
Other ways to visualize speed are a "waterfall" and trends graphs.
They are cross-referenced with the screen capture.
Compare desktop, mWeb and native for international markets.
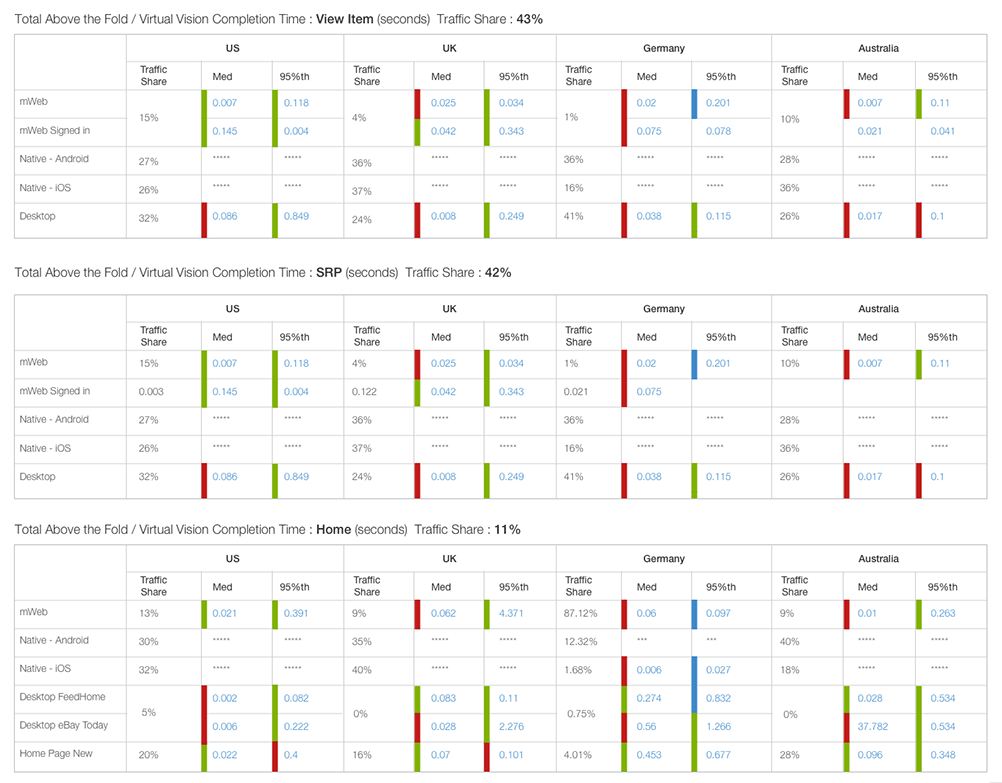
Full data view with trends as colors.
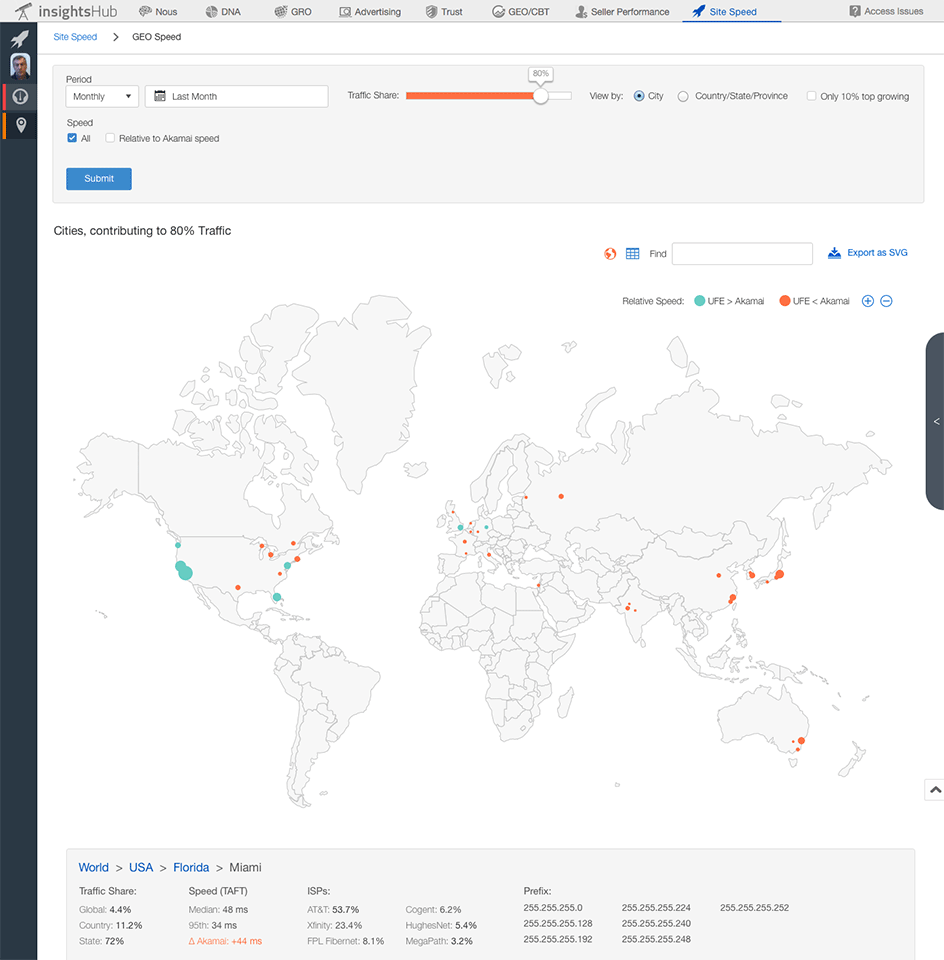
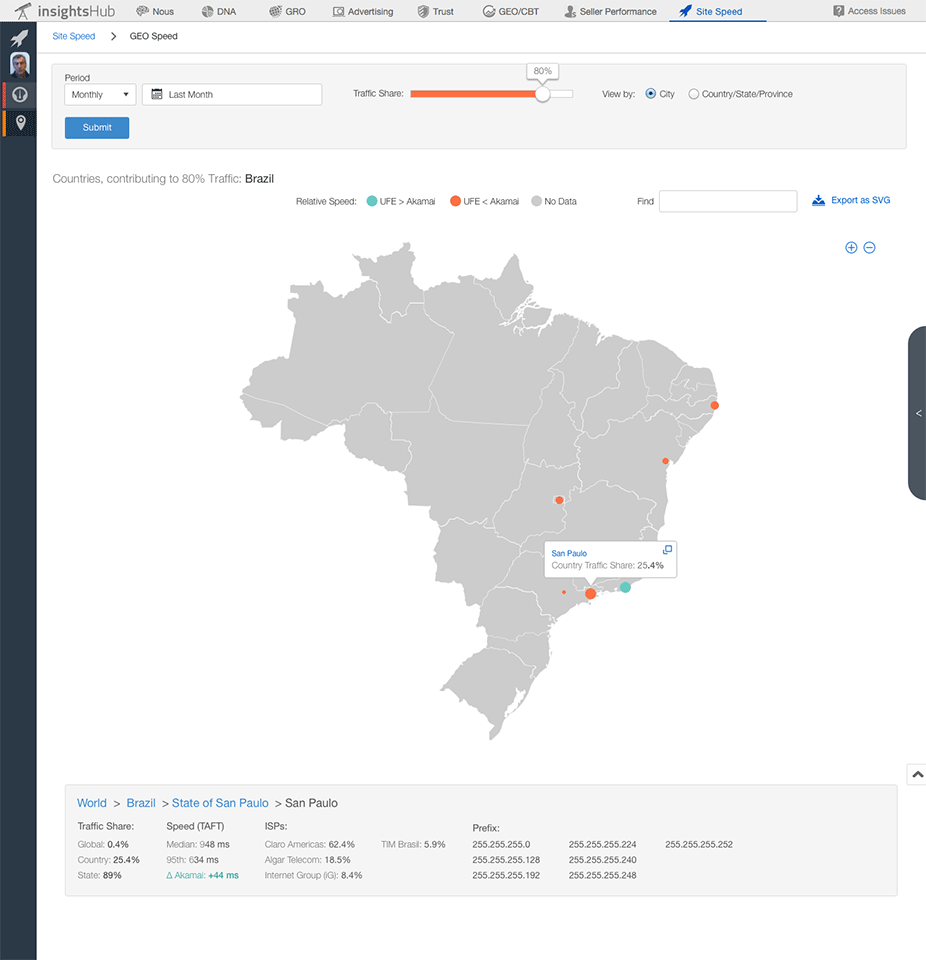
International traffic is crucial for server allocation. It also helps to reduce the Akamai costs. Map 1: traffic by city.
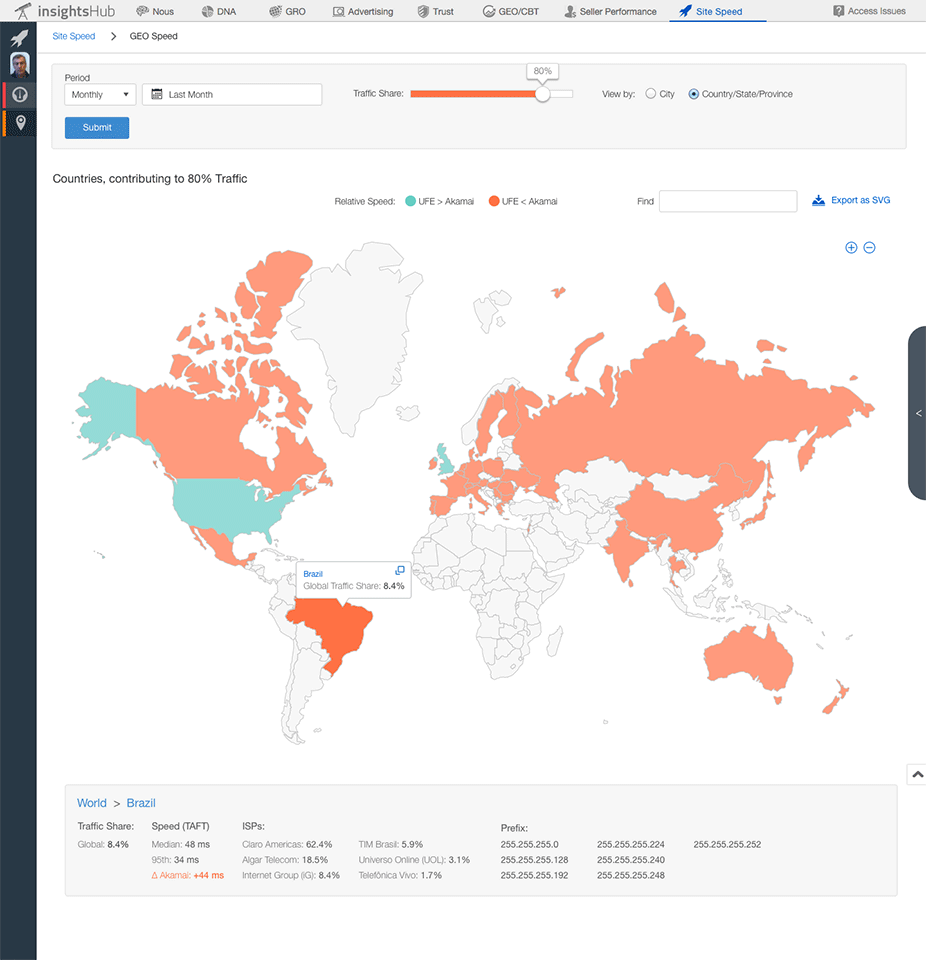
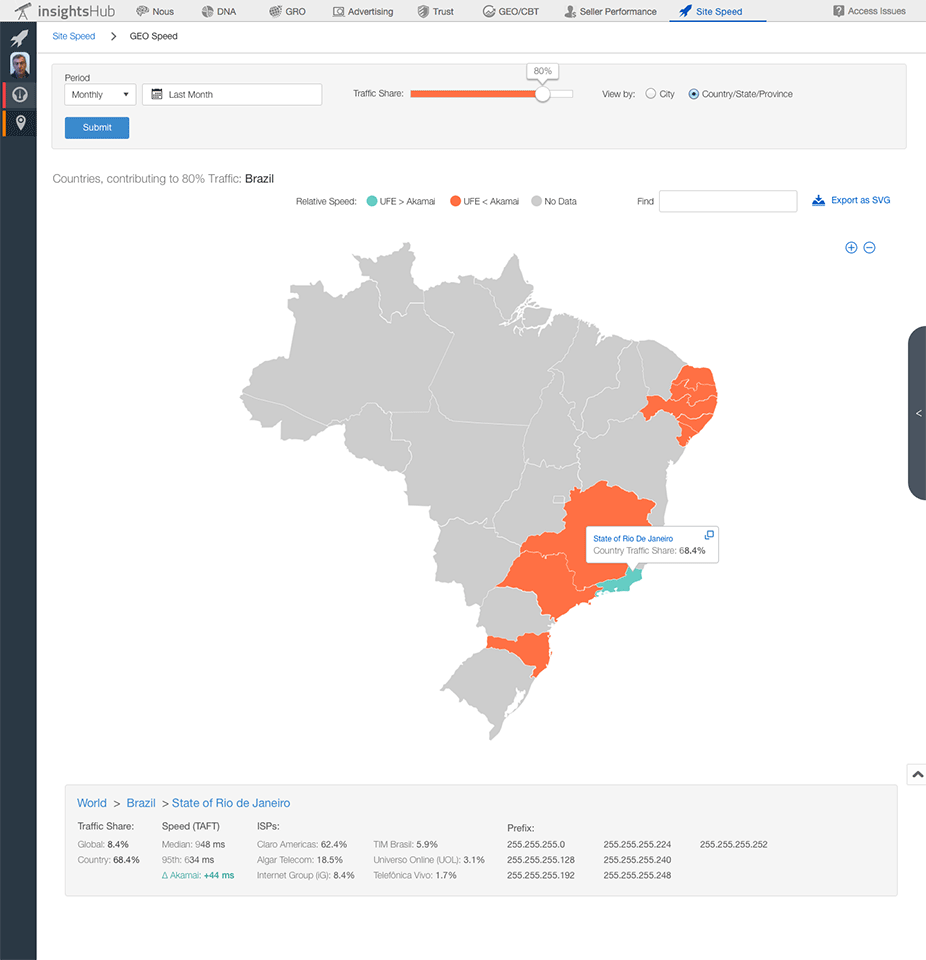
Map 2: traffic by country.
..or by its province.
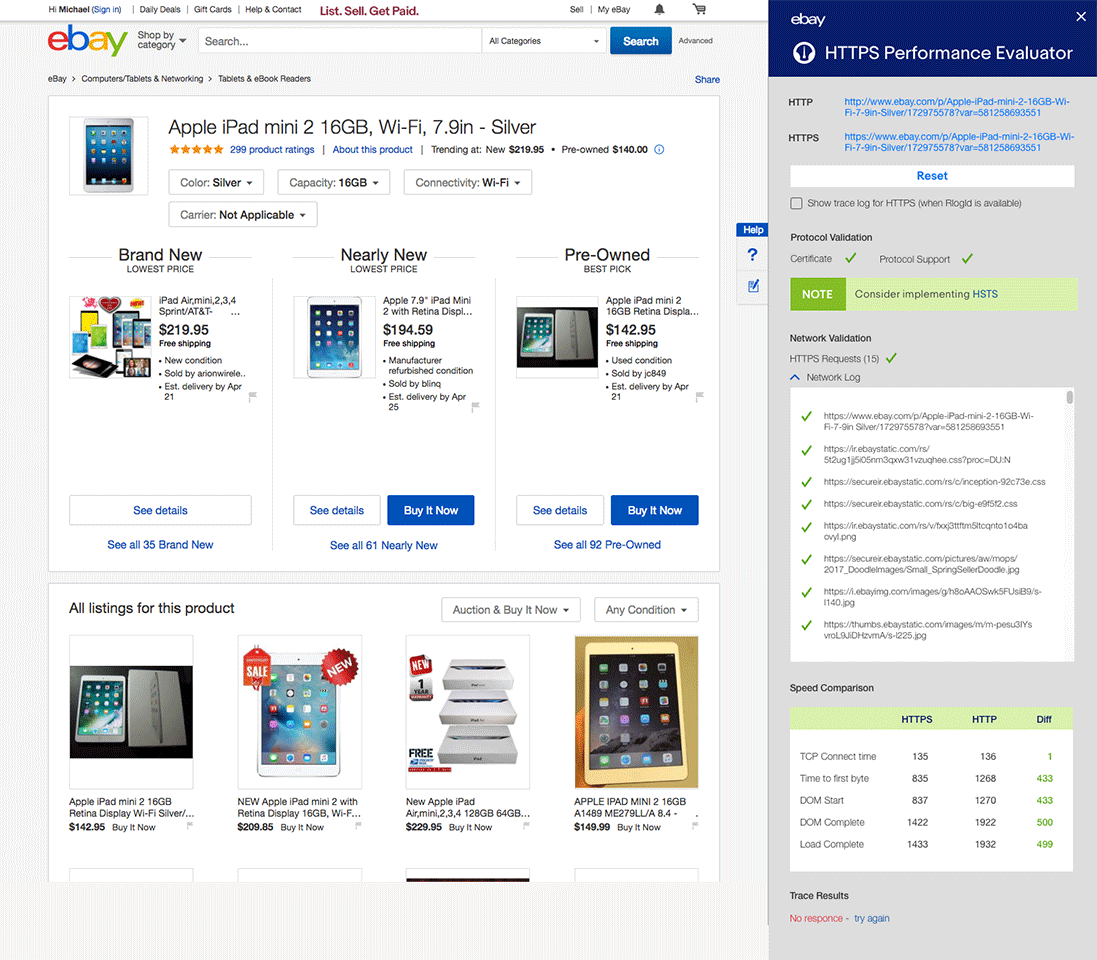
In-browser HTTPS performance evaluator as a side rail.
In-browser HTTPS performance evaluator as a side rail.
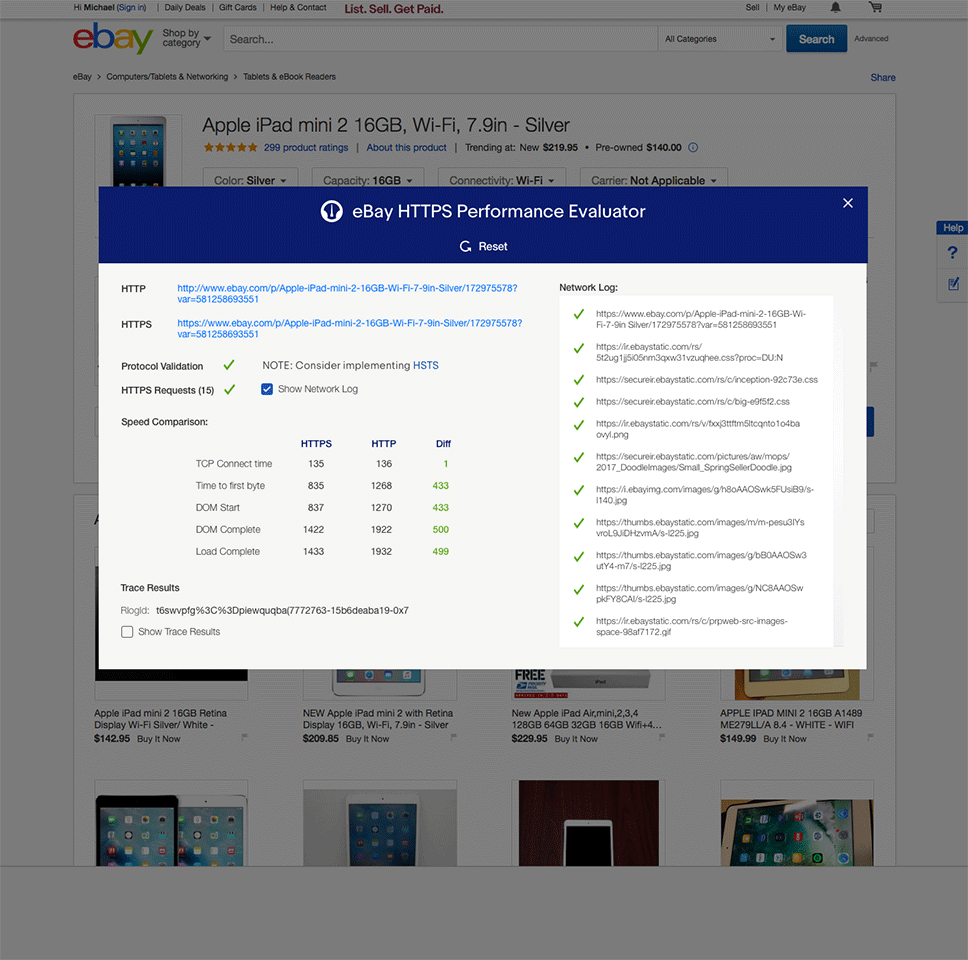
.. or as a pop-up.
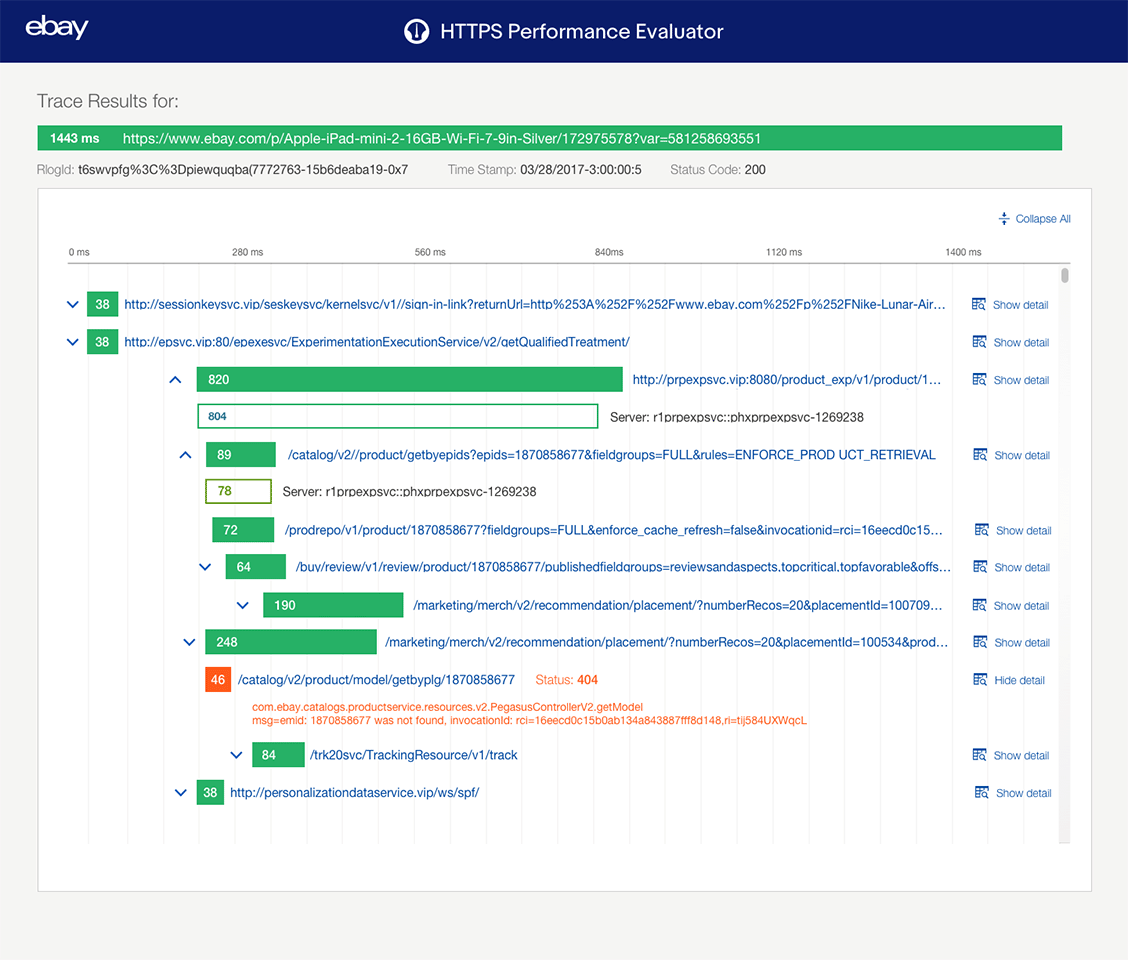
Detailed trace results.
1
2
3
4
5
6
7
8
9
10
11
12
13